

Issue detail
Select an issue in Issues to see its detail.
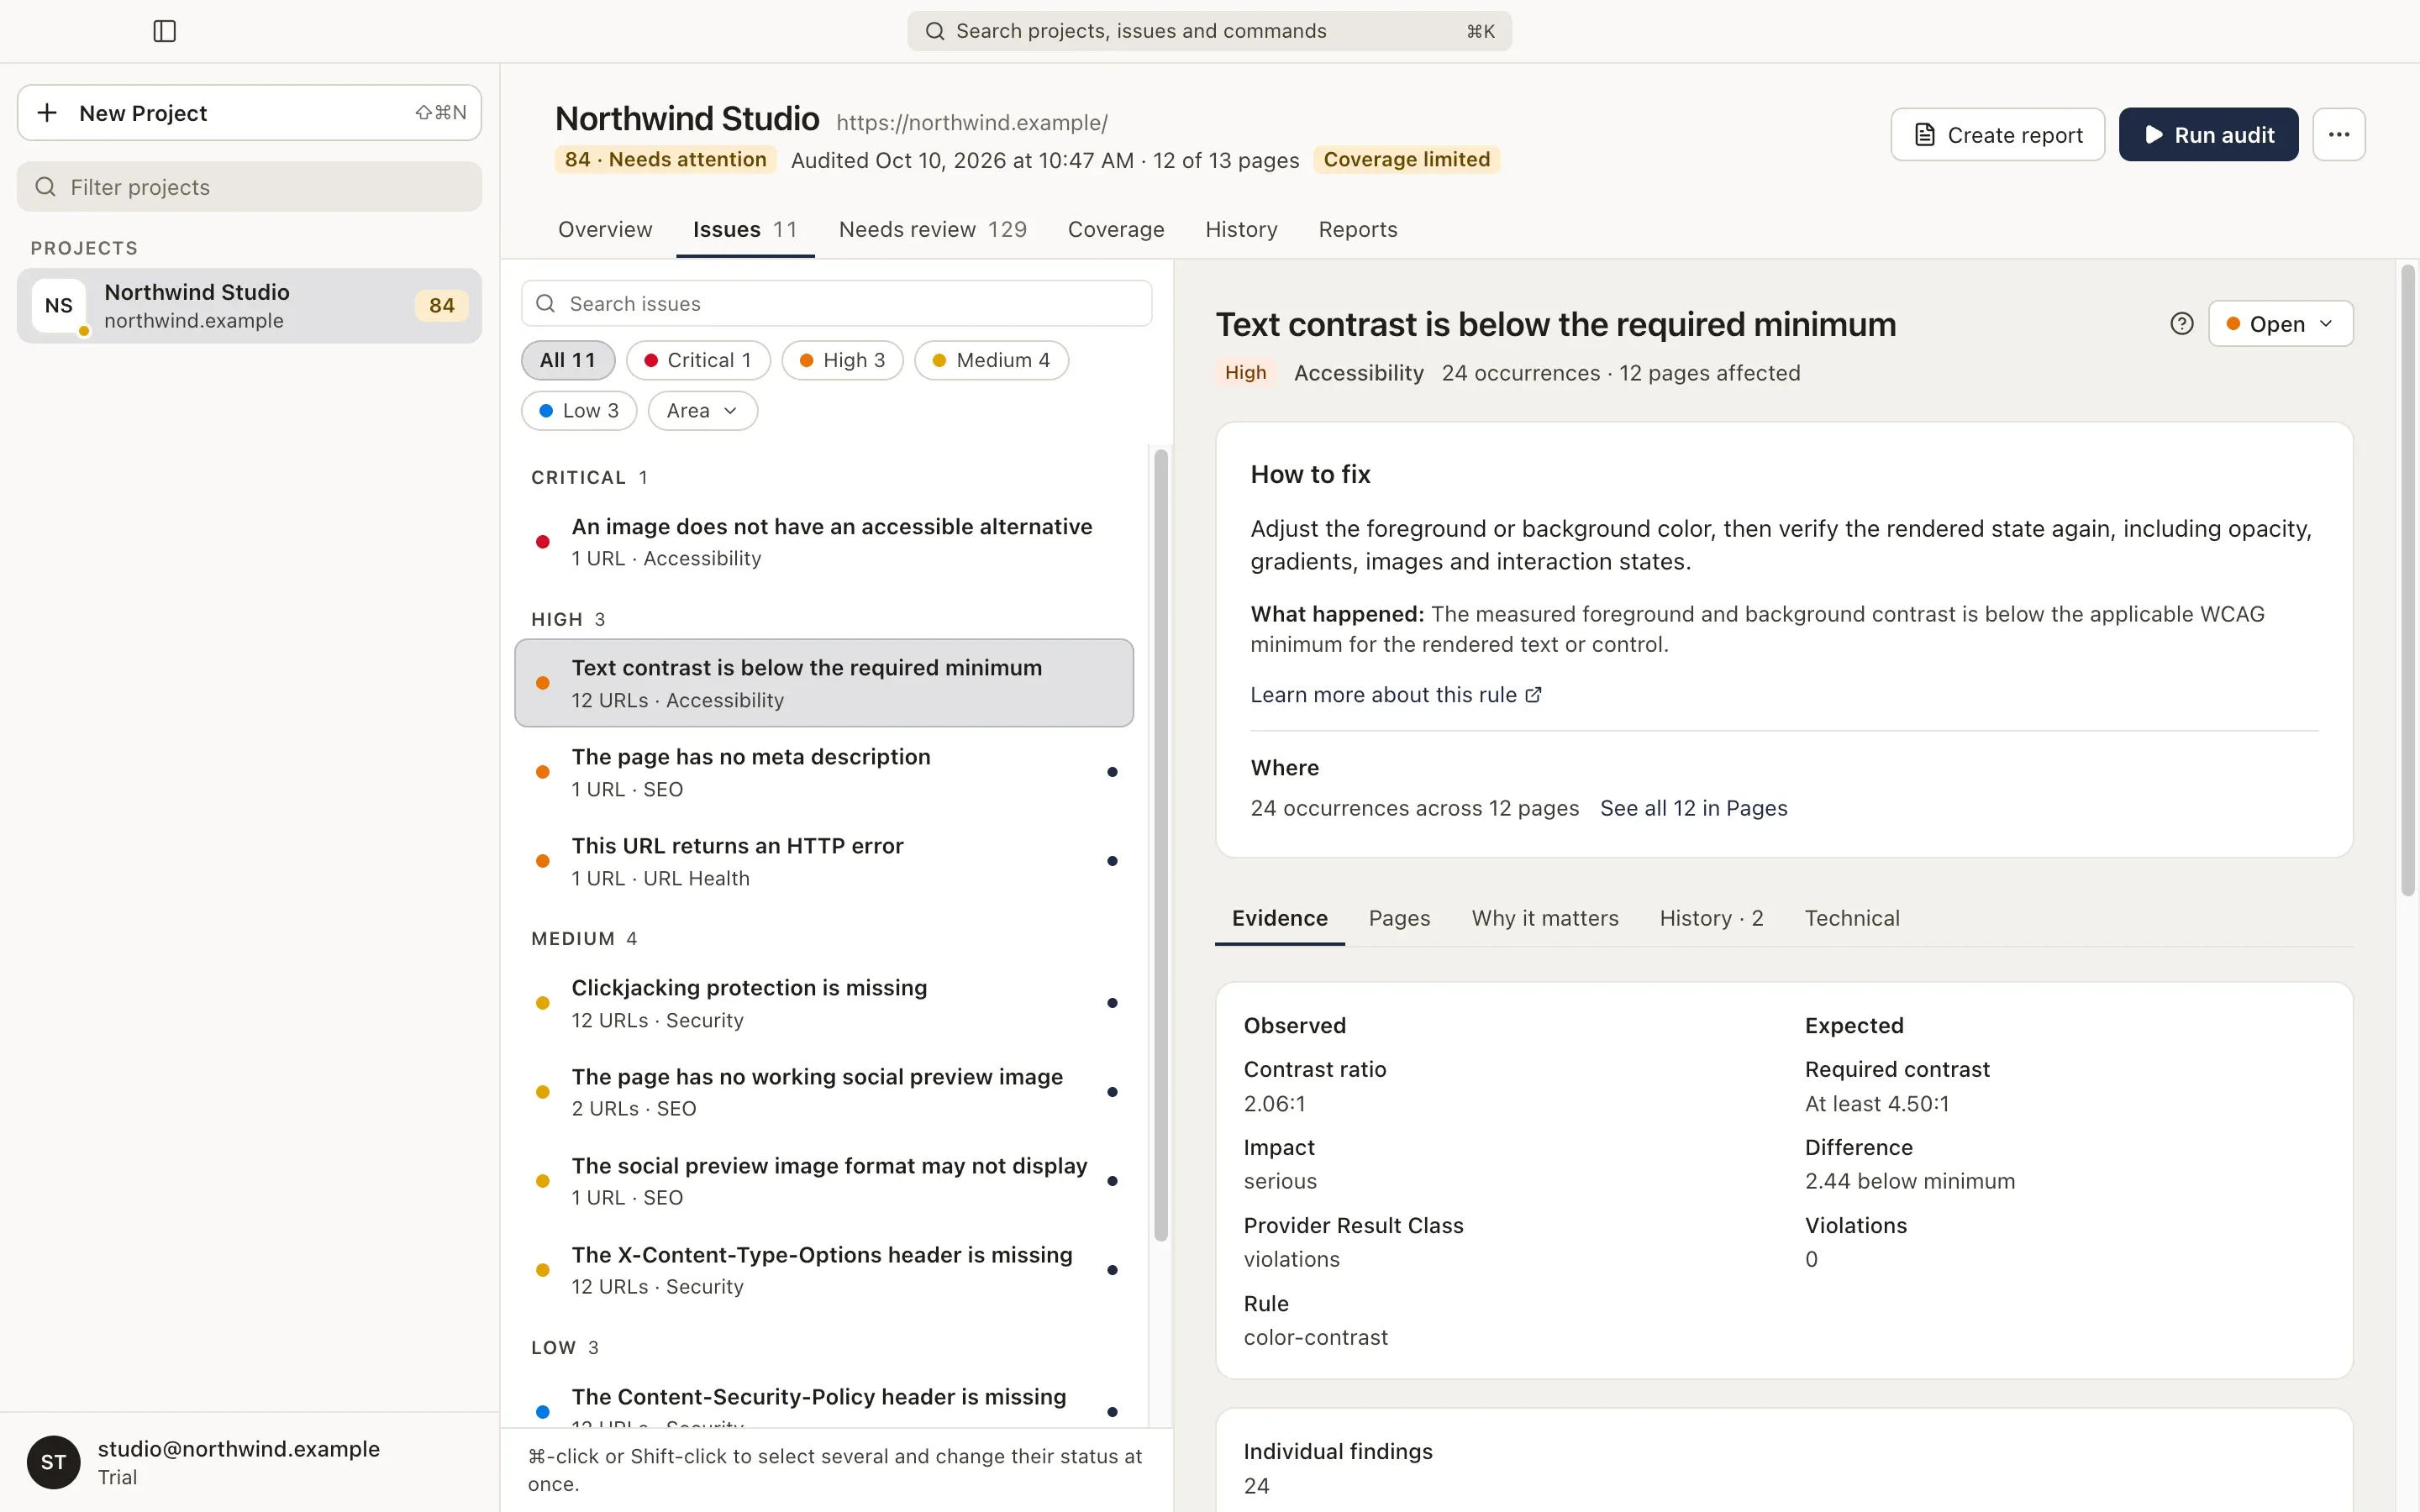
Header
Section titled “Header”The title, the severity, the area and how far the issue reaches, for example 48 occurrences · 12 pages affected. A line says how the issue changed since the previous audit, for example Still detected in the audit of Oct 3, with See history.
The status menu sets the issue to Open, Closed or Not relevant. The ? next to it explains the status.
How to fix
Section titled “How to fix”What to do, in plain words, and What happened: what the audit found. For accessibility checks, Learn more about this rule opens the rule’s documentation.
Where says how many pages and elements are affected and lists the first few. See them in Pages opens the full list.
Evidence
Section titled “Evidence”- Observed and Expected: the measured value next to the required one. For text contrast, for example, the measured ratio, the required minimum and how far below it the text is.
- Metrics: occurrences, pages affected and how many pages the rule’s check reached.
- Examples: a representative element with its HTML, its location on the page and how many times it occurs there. Show all captured examples lists every example the audit saved.
- Measurement (performance issues): what the value stands on, for example
1 lab run · Google PageSpeed Insights · mobile. With your own API key, a lab value close to its threshold is measured three times and the median decides. - Real users over time (real-user issues): the page’s weekly values for about six months against the threshold, with your audits marked, so you can see whether a fix worked. Each point covers 28 days, so a fix shows up over about four weeks.
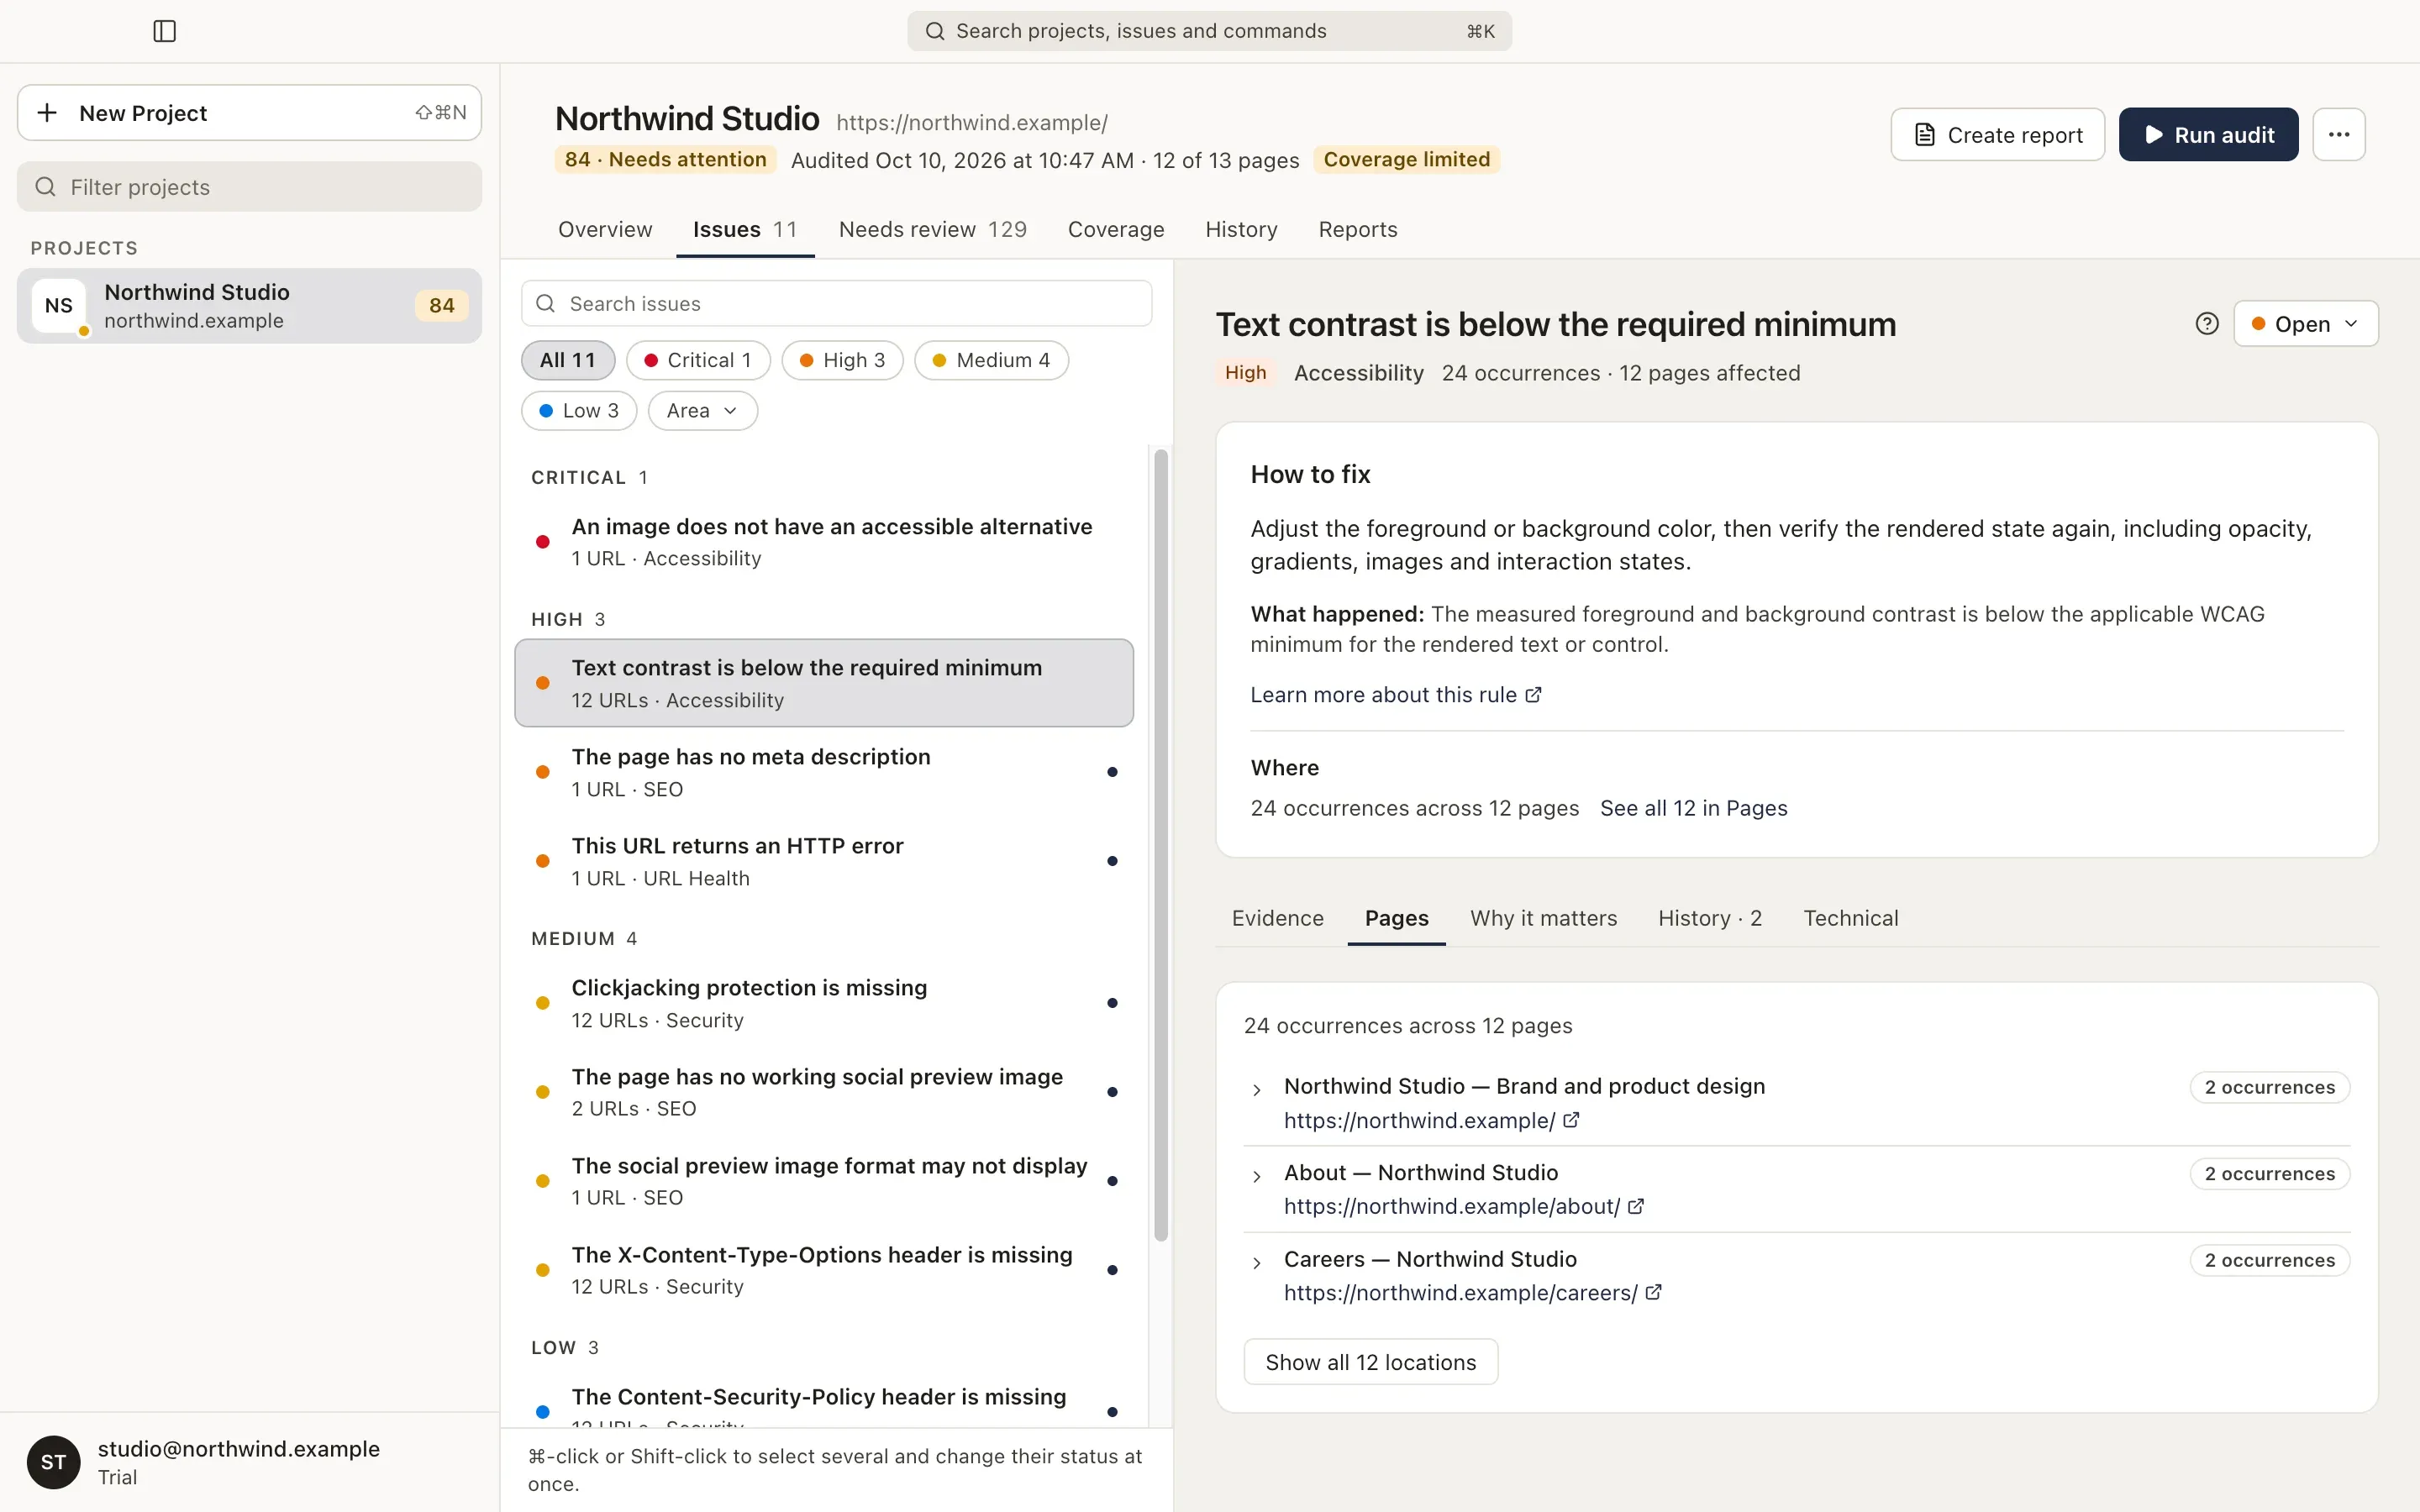
Every page the issue affects, with its title and the number of occurrences. Expand a page to see the affected elements. Show all locations opens a searchable list.
Why it matters
Section titled “Why it matters”Why the issue matters for visitors or search engines, and Done when: what a later audit needs to see to count the issue as resolved.
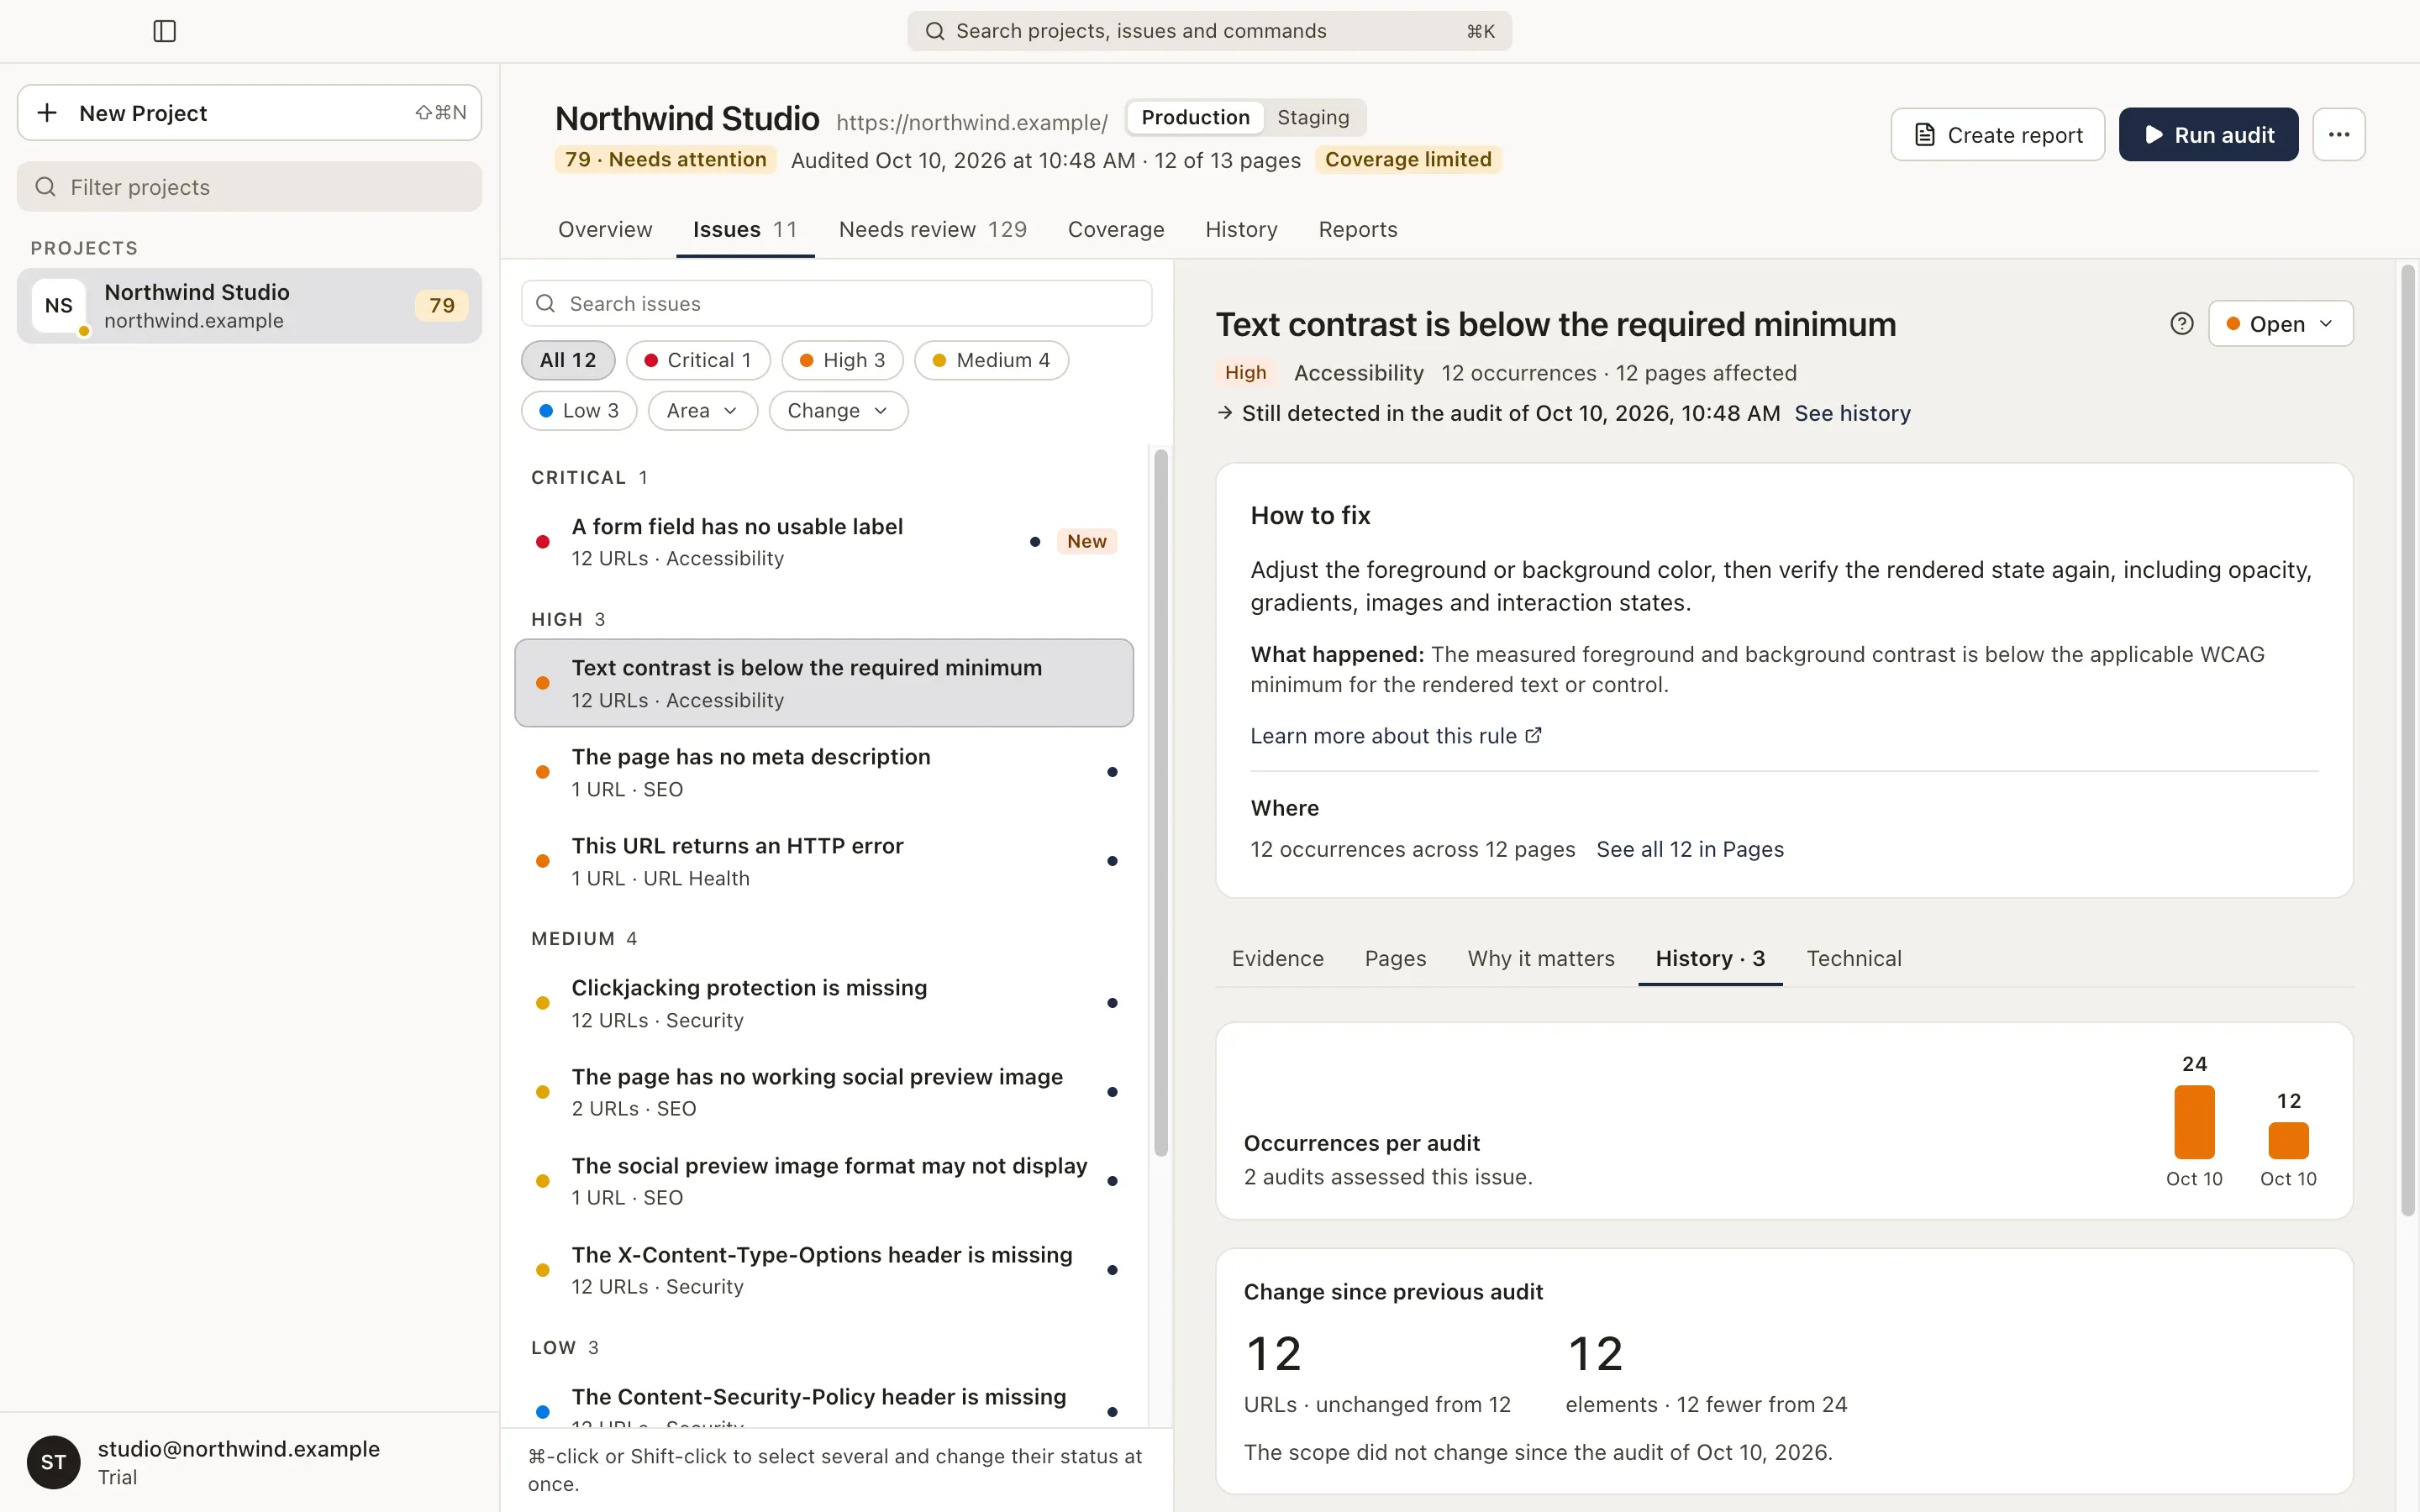
History
Section titled “History”How many occurrences each audit found, what changed since the previous audit, and the issue’s status history: who changed the status and when. A change can come from an audit, from you, from the damdit command or from an AI app through MCP.
Technical
Section titled “Technical”The rule, the evidence scope and the raw recorded results, for developers who want to see exactly what was saved.
When the numbers don’t match
Section titled “When the numbers don’t match”If the report’s totals and the saved evidence don’t fully agree, Counts may differ explains it, and the detail uses the verified evidence. Damdit never shows an incomplete measurement as a passing one.
Keyboard
Section titled “Keyboard”With the detail in focus, ↑ and ↓ open the previous or next issue, and Escape returns to the list. ← and → move between tabs.