

Overview
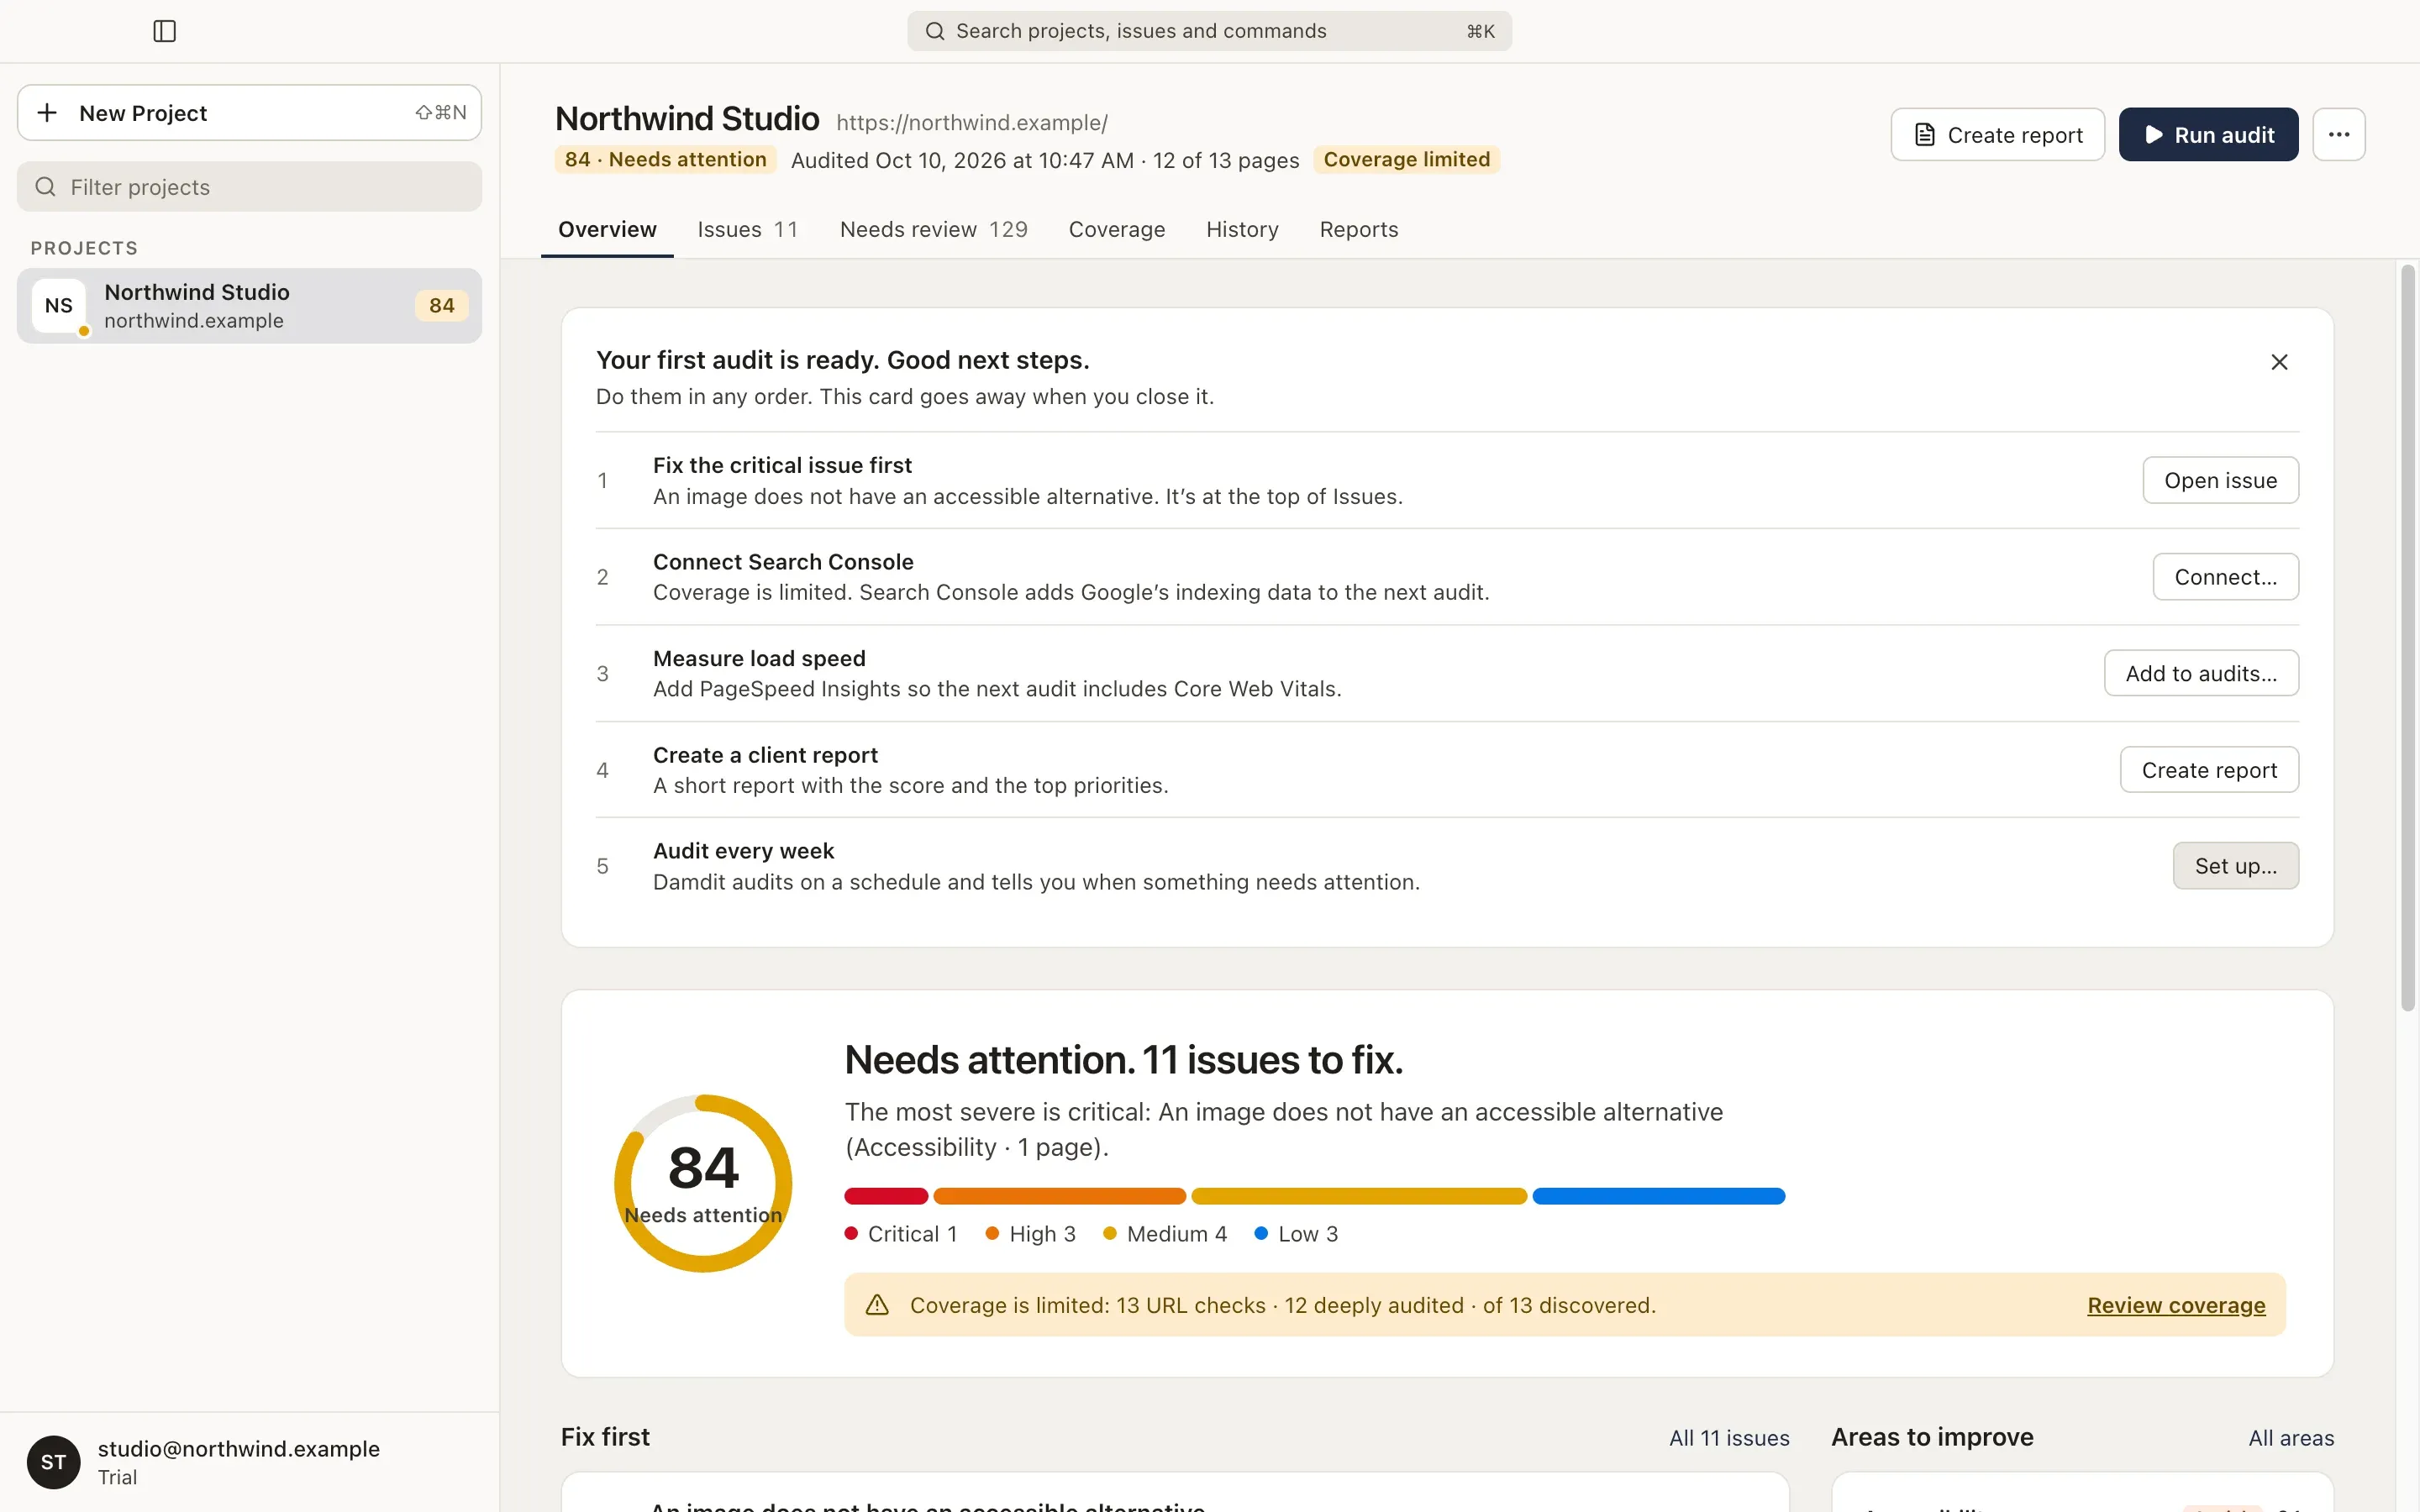
The Overview (⌘1, Ctrl+1) answers three questions about the audit you are looking at: how is the website doing, what should be fixed first, and what changed.
Verdict
Section titled “Verdict”The score ring shows the health score from 0 to 100 and its band: Good, Needs attention, At risk or Critical. Next to it, a sentence says how the website is doing, how many issues there are to fix and which one is the most severe.
The bar below counts issues by severity. Choose a severity to see only those issues.
When part of the website couldn’t be measured, a note says what the audit covered, with Review coverage. The score only covers what was measured.
Sometimes there is no score: when most of the website couldn’t be loaded, or when a core area couldn’t be measured on any page, Damdit withholds the score instead of showing a misleading number. The verdict then says why.
Fix first
Section titled “Fix first”The most severe issues, with their area, the pages they affect and their severity. Choose one to open it. All issues opens the full Issues list.
Areas to improve
Section titled “Areas to improve”Every area that scored below 100, worst first. Choose an area to see its issues. Areas that couldn’t be measured, or that weren’t part of this audit, are listed below with their reason. All areas opens Coverage.
Real-user experience
Section titled “Real-user experience”How Chrome visitors experienced the home page over the last six months, from the Chrome UX Report: Largest Contentful Paint, Interaction to Next Paint and Cumulative Layout Shift. Each row shows the latest value (the 75th percentile of the last 28 days) with Good, Needs improvement or Poor, a line of weekly values with the good threshold dashed, and whether it is Getting worse, Getting better or Stable against 12 weeks ago. Switch between Mobile and Desktop.
When Google has too little data for the home page, the card shows the whole site and says so. The card is for information only: it never changes the score or creates an issue.
It needs PageSpeed Insights with your own API key and the Chrome UX Report API enabled for that key. Otherwise the card says what is missing: Not connected, Needs setup (the API isn’t enabled) or Not enough data (the site has too few Chrome visitors, which is a limit of the data, not a clean result). Audits from before this version have no card.
Needs review, coverage and changes
Section titled “Needs review, coverage and changes”Three cards at the bottom:
- To review: observations that need a person’s judgement. They aren’t issues and don’t change the score. See Needs review.
- What this audit covered: a summary of Coverage.
- Since …: what changed since the previous audit: the score change and the issues that are New, Resolved, Reappeared or Inconclusive. See History.
Next steps after the first audit
Section titled “Next steps after the first audit”After a project’s first audit, a card suggests what to do next: fix the most severe issue, connect Search Console or PageSpeed Insights, create a client report, and schedule a weekly audit. Only the steps that still apply are listed. Close the card when you’re done with it.
Score details
Section titled “Score details”Score details and coverage, at the bottom, explains how the score was calculated: how many areas were measured, how many pages couldn’t be fully measured and how many findings are excluded as Not relevant.